2019-12-11
发表者 Venus
supervisor安装及配置已关闭评论
# 安装
[root@VM_0_7_centos ~]# yum install -y supervisor
# 查看释放了哪些文件
[root@VM_0_7_centos ~]# rpm -ql supervisor-3.1.4-1.el7.noarch
/etc/logrotate.d/supervisor
/etc/supervisord.conf
/etc/supervisord.d
/etc/tmpfiles.d/supervisor.conf
/usr/bin/echo_supervisord_conf
/usr/bin/pidproxy
/usr/bin/supervisorctl
/usr/bin/supervisord
略···
可以看出/etc/supervisord.conf是主配置文件。
[root@VM_0_7_centos ~]# cat /etc/supervisord.conf | grep -vE "^;|^$"
[unix_http_server]
file=/var/run/supervisor/supervisor.sock   ; (the path to the socket file)
[inet_http_server]         ; inet (TCP) server disabled by default
port=*:9001        ; (ip_address:port specifier, *:port for all iface)
username=root              ; (default is no username (open server))
password=root               ; (default is no password (open server))
[supervisord]
logfile=/var/log/supervisor/supervisord.log  ; (main log file;default $CWD/supervisord.log)
logfile_maxbytes=50MB       ; (max main logfile bytes b4 rotation;default 50MB)
logfile_backups=10          ; (num of main logfile rotation backups;default 10)
loglevel=info               ; (log level;default info; others: debug,warn,trace)
pidfile=/var/run/supervisord.pid ; (supervisord pidfile;default supervisord.pid)
nodaemon=false              ; (start in foreground if true;default false)
minfds=1024                 ; (min. avail startup file descriptors;default 1024)
minprocs=200                ; (min. avail process descriptors;default 200)
[rpcinterface:supervisor]
supervisor.rpcinterface_factory = supervisor.rpcinterface:make_main_rpcinterface
[supervisorctl]
serverurl=unix:///var/run/supervisor/supervisor.sock ; use a unix:// URL  for a unix socket
[include]
files = supervisord.d/*.ini
# 解释
[inet_http_server]
port=*:9001
username=root
password=root
这4行去掉前面的注释后,即为开启web端管理,默认端口9001,supervisor提供了一个简易的管理界面。
files = supervisord.d/*.ini
这行表明启动时加载supervisord.d目录下的所有ini文件,这样可以把要管理的程序独立配置。
# 添加一个shell脚本测试
[root@VM_0_7_centos ~]# cat test.sh
#!/bin/bash

for i in {1..20}
do
	current_time=`date`
	echo $current_time
	sleep 1
done
循环20次,打印当前时间
# 创建配置文件
[root@VM_0_7_centos ~]# cd /etc/supervisord.d/
[root@VM_0_7_centos supervisord.d]# vi test_script_supervisor.ini
[program:test]
command=/root/test.sh
directory=/root
priority=999
autostart=true
autorestart=true
startsecs=5
startretries=3
user=root
配置参数含义可以参考主配置文件中的配置案例,每个参数后面都带着解释。或者百度可以找到。
# 看一下supervisorctl命令用法
[root@VM_0_7_centos supervisord.d]# supervisorctl --help
supervisorctl -- control applications run by supervisord from the cmd line.

Usage: /usr/bin/supervisorctl [options] [action [arguments]]

Options:
-c/--configuration -- configuration file path (default /etc/supervisord.conf)
-h/--help -- print usage message and exit
-i/--interactive -- start an interactive shell after executing commands
-s/--serverurl URL -- URL on which supervisord server is listening
     (default "http://localhost:9001").
-u/--username -- username to use for authentication with server
-p/--password -- password to use for authentication with server
-r/--history-file -- keep a readline history (if readline is available)

action [arguments] -- see below

Actions are commands like "tail" or "stop".  If -i is specified or no action is
specified on the command line, a "shell" interpreting actions typed
interactively is started.  Use the action "help" to find out about available
actions.

[root@VM_0_7_centos supervisord.d]# supervisorctl help

default commands (type help <topic>):
=====================================
add    clear  fg        open  quit    remove  restart   start   stop  update
avail  exit   maintail  pid   reload  reread  shutdown  status  tail  version
上面为支持的动作

[root@VM_0_7_centos supervisord.d]# supervisorctl help update
update			Reload config and add/remove as necessary
update all		Reload config and add/remove as necessary
update <gname> [...]	Update specific groups
# 重载supervisor配置
[root@VM_0_7_centos supervisord.d]# supervisorctl update
test: added process group
[root@VM_0_7_centos supervisord.d]# supervisorctl status
test                             FATAL     command at '/root/test.sh' is not executable
# 通过 supervisorctl status 加配置中 program 后面的名字可以查看添加的服务状态
[root@VM_0_7_centos supervisord.d]# supervisorctl status test
test                             FATAL     command at '/root/test.sh' is not executable
看到提示致命错误,提示不可执行。说明没有执行权限。
[root@VM_0_7_centos supervisord.d]# chmod 700 /root/test.sh  # 我是用root权限执行,所以给了个700权限
[root@VM_0_7_centos supervisord.d]# supervisorctl start test
test: started
[root@VM_0_7_centos supervisord.d]# supervisorctl status test
test                             RUNNING   pid 19487, uptime 0:00:07
[root@VM_0_7_centos supervisord.d]# ps aux | grep test
root     19824  0.0  0.0 115308  1504 ?        S    20:25   0:00 /bin/bash /root/test.sh
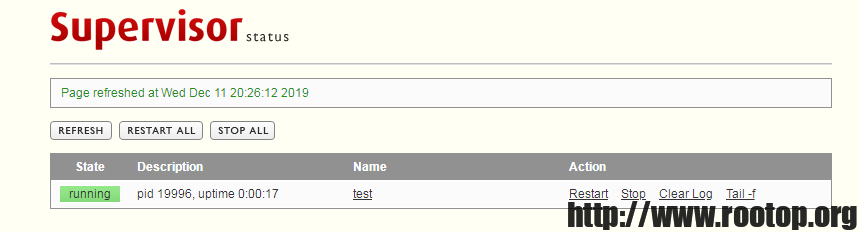
通过web界面可以查看、管理服务
如果想记录脚本执行日志,可通过/etc/supervisord.conf中的配置案例配置服务的输出日志。